Historical B/S Indicators for Candlestick Charts
By: WEEX|2025/10/23 01:21:58
0
Share
WEEX just got smarter! Review past trades and refine your strategies with our brand-new feature: Historical B/S (Buy/Sell) markers for candlestick charts! Now, you can view your past trades right on the chart, helping you make sharper decisions and trade more efficiently.
Highlights
- Trade records at a glance
- Your Buy (B) and Sell (S) points are automatically marked on the chart.
- Each marker shows your precise trade time and price, helping you review past orders at a glance.
- Comprehensive coverage
- Spot trading: Full support for marking trades across all spot pairs.
- Futures trading: Clearly shows open and close points, distinguishing between long and short positions.
- Rich interactions
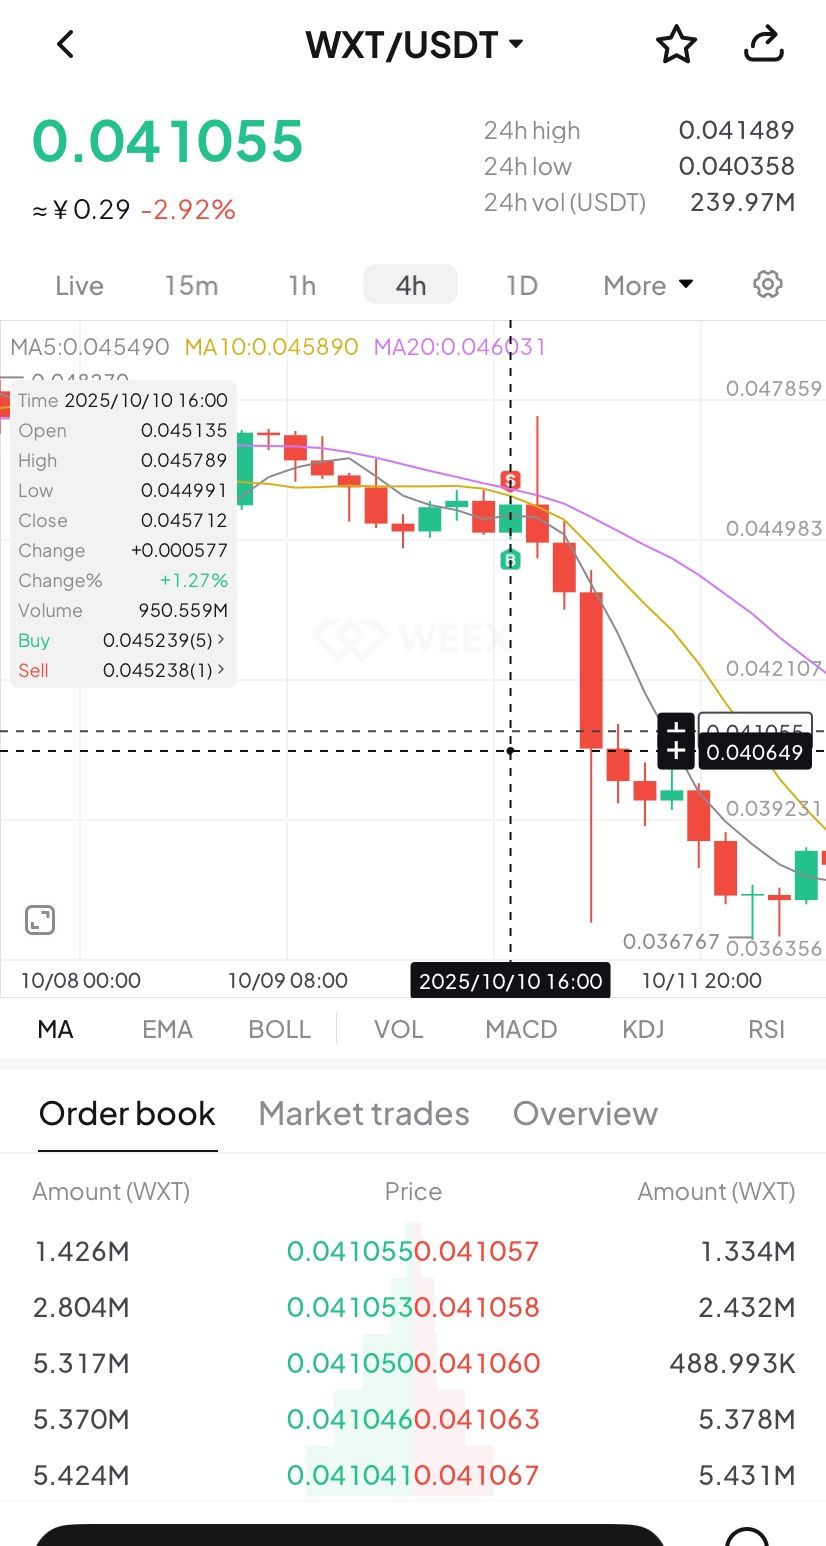
- Tap any marker (B or S) to view detailed trade information, such as:
- Trade time: Review exact trade times and corresponding market conditions.
- Execution price: Displays the average filled price of historical trades.
- Trade count: Quickly check the number of trades in a certain period.
- Markers update dynamically as you zoom and drag the candlestick. Seamlessly review up to 100 executed trades from the last 90 days.
- Universal access
- Available on both iOS and Android: Access your trade history anytime, on any mobile device.
- Full currency coverage: Supports all pairs in your portfolio, across both spot and futures markets.
How to Use?
- Open the WEEX app and go to any pair's chart page.
- Tap the candlestick chart and enable the "Order history" feature in the chart settings (enabled by default.)
- If trades exist for that pair, B and S markers will instantly show up on the chart.
- Tap any marker to check the full details of that transaction.
Where to use it
- Review strategies: Quickly review your buy and sell points combined with market trends to refine your strategy.
- Analyze PnL: Easily pinpoint profitable or losing trades to learn from your past performance.
Understand trends: Combine your trade history with the candlestick chart data for deeper market and behavioral analysis.
Feature preview
- On/off toggle: Use the "Settings" icon to switch the "Order History" feature on or off (enabled by default).
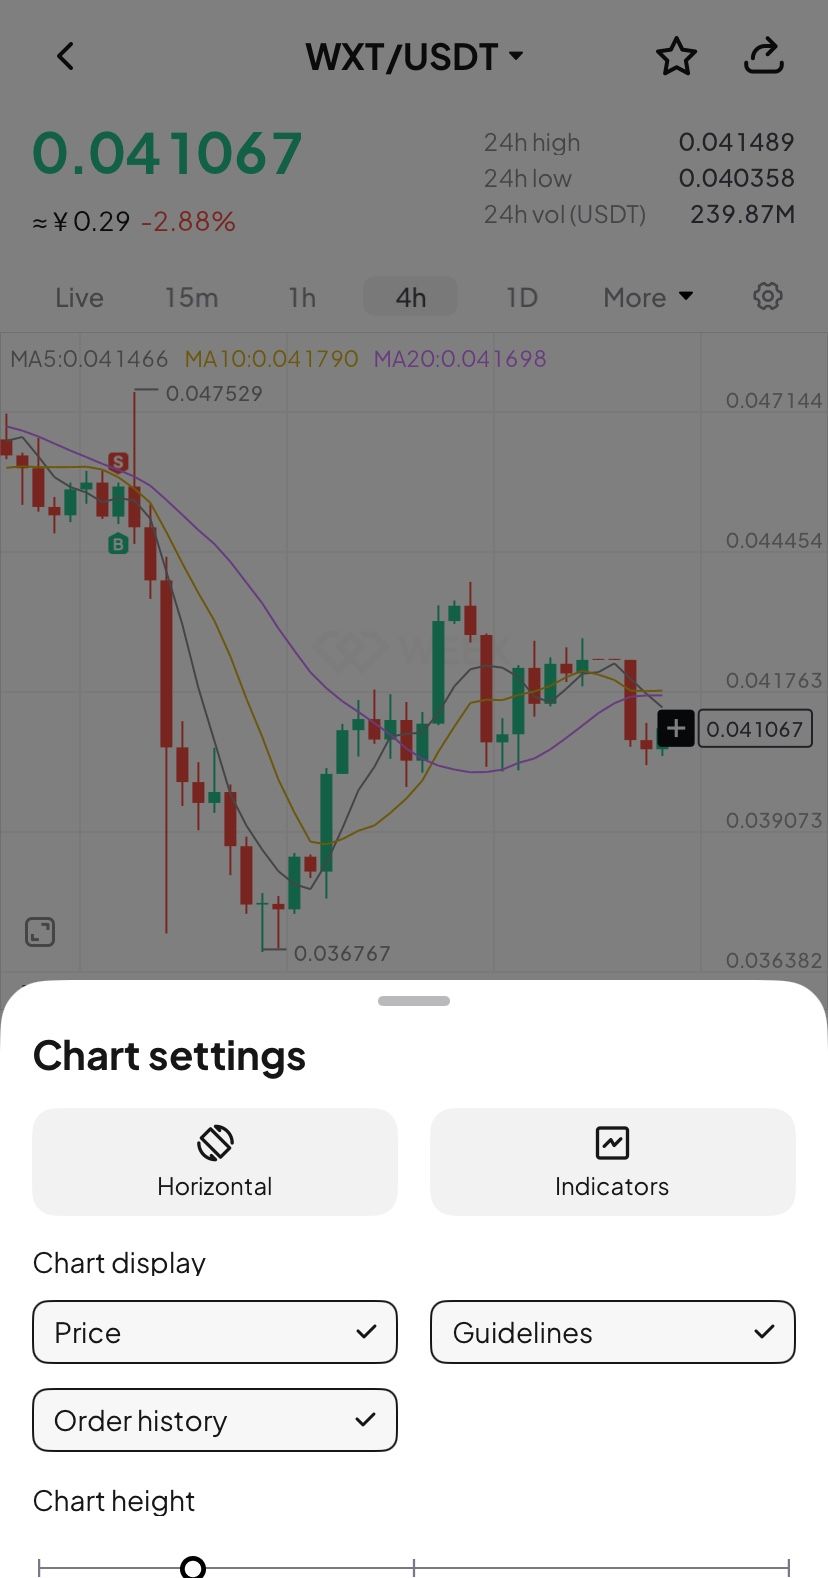
- B (Buy) marker: Green marker showing your exact buy action.
- S (Sell) marker: Red marker identifying every sell transaction.
- Details pop-up: Tapping the marker brings up a card with key data (time, price, and count).
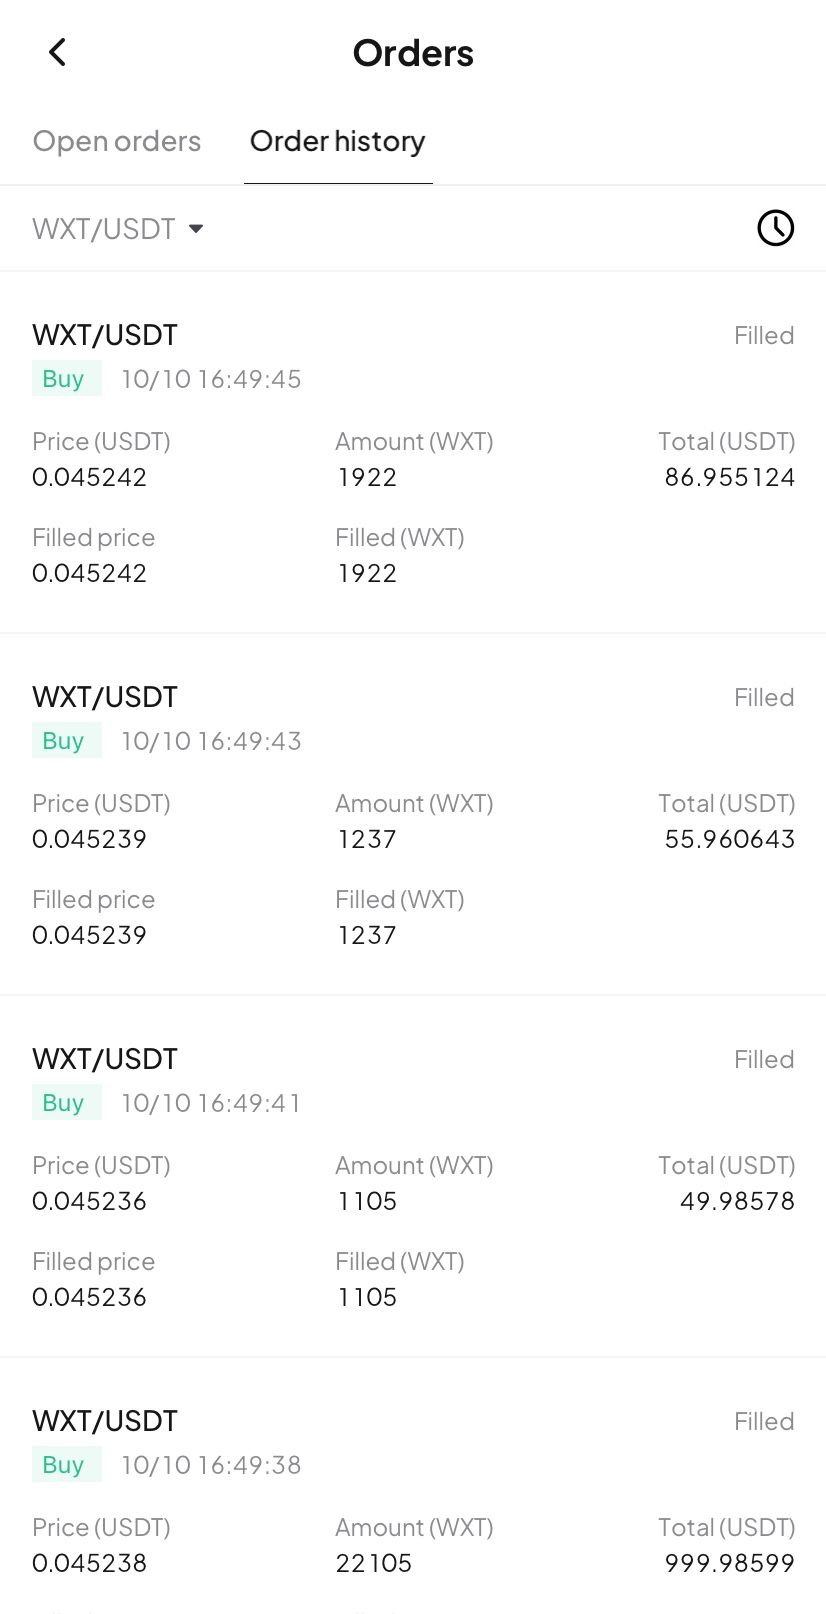
- Full breakdown: Tap the details card to open the "Order History" page and view your trading record.
Try now
Update your WEEX app to the latest version to experience our new Buy/Sell markers! Gain clarity and transparency in your trades, empowering smarter investment decision!
You may also like

A South Korean company that learned the strategy of hoarding coins, from a bull market to delisting?
When the overall momentum of the Korean stock market is strong, this batch of cryptocurrency concept stocks, branded as the "Korean version of Strategy," finds itself at a crossroads of life and death.
Where is Zhao Changpeng's billion-dollar investment going? YZi Labs' investment landscape fully revealed
Zhao Changpeng's billion-dollar new "family office" YZi Labs investment landscape revealed: 70% of the funds are committed to the crypto ecosystem, while 30% are cross-industry bets on AI and biotechnology, launching a new capital experiment in the post-Binance era.
Semiconductor stocks plummet, yet Anthropic wants to create a 2nm chip
Abandoning TSMC and teaming up with Samsung. Anthropic launches a self-developed 2nm chip program, challenging Nvidia and starting a battle to break through computing power costs.
WEEX API Broker Program: Turn Your Trading Platform Into a Revenue Engine
Become a WEEX API Broker and earn up to 70% trading fee sharing. Get institutional-grade liquidity, OAuth Fast Connect, and a 4-5 day integration for your AI trading platform, bot, or signal community.
How to choose between buying discounted ETH, Bitmine, and SharpLink?
The answer may not lie in whose story is told better, but in specific dimensions such as cost of holding, financing ability, liquidity, and whether the narrative can be realized.
Do you want to buy CRCL?
A detailed breakdown of Circle's business fundamentals and valuation logic: The panic over OUSD and the market correction have triggered a short-term mispricing, presenting an opportunity for left-side positioning and legislative speculation below $60.
Wosh: Inflation has cooled in recent weeks, AI is reshaping the economy, and forward guidance has lost its necessity
Federal Reserve Chairman Waller clearly stated at the ECB forum that the Fed will abandon forward guidance on interest rates, with future decisions relying entirely on real-time economic data. He noted that inflation risks in the U.S. have decreased over the past four weeks, but the ultimate impact ...
The most secretive AI winner
A century-old company that sells toilets and produces MSG has seen its stock price soar by "positioning" core materials for AI chips. This article clarifies the explosive opportunities for domestic substitution of semiconductor materials in the A-share market.
Looking at Stripe's ambitions and the future of stablecoins from OUSD
Stripe enters the stablecoin network battle with OUSD, a comprehensive look at the third paradigm evolution of digital dollars and the new infrastructure for global payments in the AI era.
From Pump.fun to Collector Crypt: Has Solana's income throne changed hands?
The revenue from consumer applications on Solana is no longer solely reliant on meme coin issuance, but is gradually spreading to more consumption scenarios.
Dan Bin's latest speech: Don't miss out on a great era
Don't let hesitation trap your steps, and don't let shortsightedness waste the passing years—make sure not to miss this magnificent era that belongs to us.
Robinhood launches its own blockchain, no longer wanting to be a tenant on others' chains
While laying off employees and issuing bonds, it is the predictive market business that temporarily supports the income.
Why Tokenized Stocks Are Booming in 2026 While Crypto Is Still Struggling
Why are tokenized stocks booming while the crypto market struggles? Explore the latest 2026 data, institutional adoption, and what it means for traders.
Former ByteDance employee's account: How I started with two Pinduoduo hard drives and made six times the profit with Seagate to achieve financial freedom?
A programmer from a big tech company bought hard drives on Pinduoduo and, following clues, managed to accurately capture the sixfold rising stock Seagate using the "finding daily anomalies + 13F institutional verification" framework, making a wild profit of $400,000 and achieving financial freedom.
MiCA reshuffle begins, Binance temporarily bids farewell to the EU
What Binance leaves behind is not scattered retail investors, but a whole batch of high-value users who are forced to liquidate and have almost nowhere to go.
How does Gate redo "buying and selling stocks" from the cryptocurrency world to the stock market?
The competition logic of exchanges has changed.
Visa and Mastercard join 140 giants to launch a new stablecoin, but the impact on the market landscape may still be limited
As an important milestone event in the stablecoin landscape, OUSD is likely to change the existing stablecoin landscape and significantly increase the adoption rate of stablecoins in the global financial system.
Circle CEO responds to OUSD's challenge: Stablecoins are a winner-takes-all business, and we will not slow down
OUSD was jointly launched by more than 140 giants, causing Circle's stock price to plummet in a single day. Circle's CEO personally wrote a response, clarifying USDC's moat from three aspects: network effects, liquidity, and regulation, and dismantling OUSD's three selling points of "free redemption...
A South Korean company that learned the strategy of hoarding coins, from a bull market to delisting?
When the overall momentum of the Korean stock market is strong, this batch of cryptocurrency concept stocks, branded as the "Korean version of Strategy," finds itself at a crossroads of life and death.
Where is Zhao Changpeng's billion-dollar investment going? YZi Labs' investment landscape fully revealed
Zhao Changpeng's billion-dollar new "family office" YZi Labs investment landscape revealed: 70% of the funds are committed to the crypto ecosystem, while 30% are cross-industry bets on AI and biotechnology, launching a new capital experiment in the post-Binance era.
Semiconductor stocks plummet, yet Anthropic wants to create a 2nm chip
Abandoning TSMC and teaming up with Samsung. Anthropic launches a self-developed 2nm chip program, challenging Nvidia and starting a battle to break through computing power costs.
WEEX API Broker Program: Turn Your Trading Platform Into a Revenue Engine
Become a WEEX API Broker and earn up to 70% trading fee sharing. Get institutional-grade liquidity, OAuth Fast Connect, and a 4-5 day integration for your AI trading platform, bot, or signal community.
How to choose between buying discounted ETH, Bitmine, and SharpLink?
The answer may not lie in whose story is told better, but in specific dimensions such as cost of holding, financing ability, liquidity, and whether the narrative can be realized.
Do you want to buy CRCL?
A detailed breakdown of Circle's business fundamentals and valuation logic: The panic over OUSD and the market correction have triggered a short-term mispricing, presenting an opportunity for left-side positioning and legislative speculation below $60.

Customer Support:@weikecs
Business Cooperation:@weikecs
Quant Trading & MM:bd@weex.com
VIP Program:support@weex.com