Bitcoin Price & Ethereum Price Outlook: Why BTC and ETH Are Rising and Whether the Crypto Bounce Will Continue
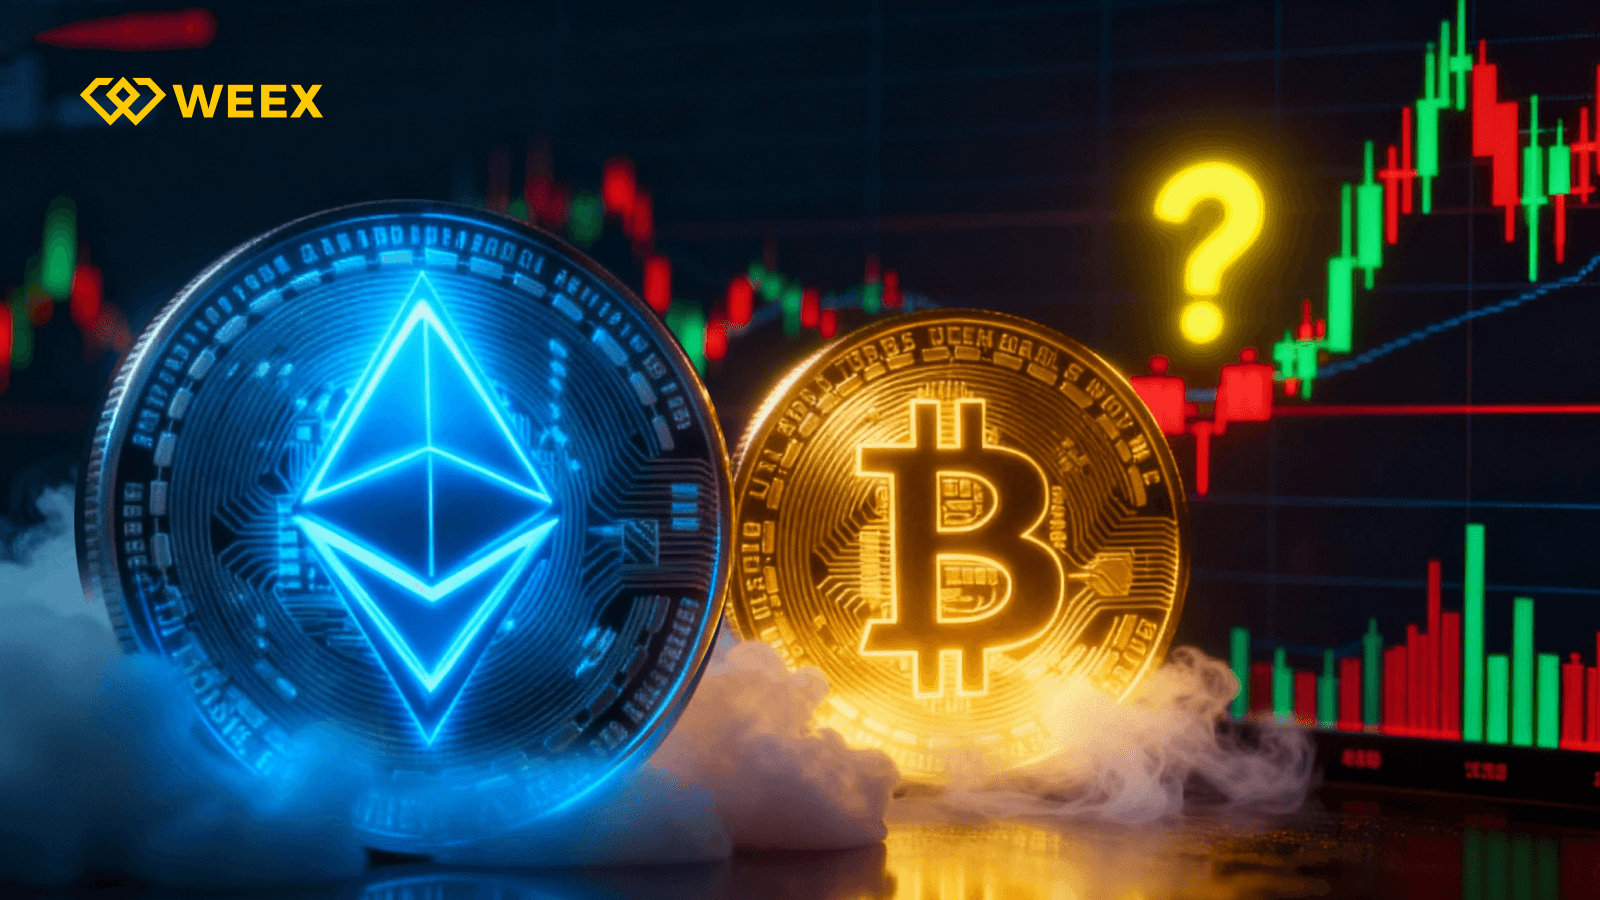
Late November brought a thanksgiving lift to the crypto markets: Bitcoin price rallied from recent lows near the low-$80k range to briefly top the $90k mark, while Ethereum price likewise recovered to roughly the $3,000 neighborhood. The relief has sparked renewed debate among traders and analysts: Is this simply a technical bounce in a choppy market, or the early stage of a meaningful reversal? Understanding the drivers behind the recovery — and separating short-term noise from long-term structure — is essential for navigating what comes next.
What Drove the Bounce
The latest rebound in Bitcoin price and Ethereum price wasn’t driven by a single catalyst, but by a sequence of reinforcing dynamics that unfolded in three stages.
Oversold Technicals Set the Foundation
Following several weeks of sustained downward pressure, both Bitcoin price and Eethereum price moved into technically oversold territory. Multiple indicators pointed to a market reset:
- RSI (Relative Strength Index) and momentum readings reached historically low levels
- Sentiment metrics signaled stabilization after an extended decline
- Order flow indicated a moderation in sell activity
CoinDesk reported that over $200M in liquidation occurred shortly before the rebound. Such events often mark a technical clearing of positions, helping set the stage for a recovery. Overall, the market entered conditions consistent with the early phase of a technical bounce.
Market Conditions Enhanced the Price Reaction
The rebound unfolded during a period of lighter-than-usual market liquidity:
- Holiday and weekend trading naturally led to softer volumes
- With fewer active market participants, moderate buy interest had an outsized effect on price
- A combination of short unwinding and opportunistic buying contributed to a swift upward response
In such conditions, crypto often displays strong price sensitivity to order flow — even modest activity can generate meaningful movement. The lighter market environment helped amplify positive momentum.
Cross-Market Risk Appetite Added Additional Momentum
Global risk markets also turned upward:
- Major technology stocks posted a strong rebound
- Equity markets saw increasing risk appetite
- Investors began rotating back into higher-beta assets, including crypto
Positive sentiment from traditional markets spilled over into digital assets, strengthening BTC and ETH price’s momentum. Broader market optimism acted as a complementary catalyst.
Is It Technical Reset or Structural Reversal?
The key question for traders is: does this bounce mark the beginning of a new uptrend, or is it simply a technical reset within the current trading range? At this stage, the price action aligns more closely with a technical rebound rather than a fully validated structural shift.
Why It Looks Like Technical Relief
- Oversold conditions often lead to technical recoveries
- Reduced liquidity can result in more pronounced price responses
- Short covering can temporarily increase upward flow
- Macro variables such as rates, inflation, and policy remain key considerations
Taken together, these dynamics can generate swift upward moves that require further confirmation to establish longer-term direction.
What a Structural Reversal Would Require
A structural shift typically becomes clearer when the market demonstrates:
- Higher lows on multi-day or weekly charts
- Breaks and holds above key resistance zone (e.g., BTC price $93k–$100k, ETH price $3,800–$4,000)
- Steady spot and ETF inflows
- Supportive macro alignment (especially dovish rate expectations)
- Balanced and constructive derivatives positioning
As these conditions develop, the broader trend will become easier to validate.
What Traders Should Watch Next
The transition from a short-term rebound to a structural uptrend depends on several key indicators. These signals help distinguish temporary price reactions from developments that reflect broader market strength. Monitoring the four core areas below can provide valuable insight into market conditions and future direction.
Spot & ETF Inflows: The Measure of Real Demand
Spot demand, especially from institutional channels such as Bitcoin ETFs, remains one of the strongest indicators of long-term market momentum.
Why It Matters
- Authentic Demand: Spot inflows reflect actual asset purchases rather than leverage-driven positioning.
- Structural Base: Institutional flows create a stable, long-term foundation for bull markets.
What Traders Should Monitor
- Consistent Trend: Multi-week periods of steady net inflow are more meaningful than short-lived spikes.
- Supply Dynamics: Inflows that regularly exceed daily mined supply can signal resilient structural demand.
- Capital Rotation: Observing how capital rotates between spot ETFs, futures products, and stablecoin holdings can offer clues about evolving market preference.
If spot demand strengthens, the current rebound has the potential to evolve into a more extended upward trend.
Derivatives Positioning: Assessing Leverage, Sentiment, and Liquidation Risk
Derivatives markets, including futures, options, and perpetual swaps, play an important role in short-term price action. A balanced derivatives structure supports trend continuation, while an imbalanced one is prone to rapid market adjustments.
Why It Matters
- Risk Indicator: Excessive leverage increases the likelihood of significant market adjustment due to liquidation.
- Sentiment Insight: Funding rates provide a snapshot of market sentiment (healthy bullish, overheated, or fearful).
- Price Magnets: Options positioning (e.g., Gamma concentrations, "Max Pain") can create short-term price magnets, guiding market behavior.
What Traders Should Monitor
- Funding Rate Normalization: Look for a "positive but moderate" rate (healthy bullishness). Rates that are extremely positive may suggest an overheated market, while negative rates could reflect caution or hedging pressure.
- Futures Open Interest (OI): Increasing OI with rising prices suggests a strong, confirmed trend. Conversely, rising OI with falling prices can indicate that leveraged short positions are building, which could lead to a potential market shift.
- Options Skew: A return to bullish skew indicates a recovery in risk appetite, while a bearish skew signals increased hedging demand.
- Liquidation Heatmaps: Clusters if liquidations indicate key price levels which could trigger accelerated momentum if breached.
A stable, normalized derivatives structure creates a more predictable environment and often supports a smoother, more sustainable market trend.
Macro Policy Environment: The External Liquidity Anchor
Cryptocurrency markets no longer operate in isolation. The medium-term direction of digital assets is increasingly intertwined with the broader global macroeconomic landscape, especially U.S. monetary policy.
Why It Matters
- High-Beta Asset: Bitcoin is increasingly behaving as a high-beta macro asset in response to global risk sentiment.
- Liquidity Conditions: Interest rate expectations are key drivers of global risk appetite and play a significant role in determining capital flows into the crypto market.
What Traders Should Monitor
- Federal Reserve Communication: Pay attention to whether the Fed signals easing (bullish for risk assets) or tightening (bearish for risk assets).
- Interest-Rate Expectations: Track futures and the Dot Plot for signals of falling rate expectations, which support accumulation cycles.
- Dollar Index (DXY): A Weakening DXY has historically shown a strong inverse correlation with Bitcoin, often acting as a tailwind for Bitcoin price movement.
A shift toward more accommodative macro policy, even if primarily indicated through rhetoric, could catalyze the early stages of a structural trend reversal, providing momentum for multi-quarter upward cycles in crypto markets.
Conclusion
The recent rebound in Bitcoin price and Ethereum price is a constructive and positive development, supported by favorable technical conditions, lighter liquidity, and stronger sentiment across broader markets. While the move is encouraging, it is best viewed as a technical recovery within a developing blockchain market structure. A larger trend shift is taking shape, with confirmation likely to come from steady inflows, a more consistent market framework, and clearer macro alignment. For now, traders can view the rally as a promising step forward and continue following a disciplined, data-driven approach as the next trend emerges.
You may also like

What Is SAOS? Strategic American Oil Supply Token Explained
SAOS is a meme token on Solana with a 75,000 USD market cap and 22,000 USD locked liquidity, positioned around oil supply themes but lacking real asset backing
It thrives on pure narrative speculation, with no utility, website, or doxxed team, making it highly volatile and attention-dependent
Traders should distinguish SAOS from legitimate real-world asset projects, as its branding is speculative rather than substantive
Positive aspects include locked liquidity reducing rug pull risks, but low trading activity signals high uncertainty
How to Buy Public Asset Control (PAC) Token in 2026: Latest Solana Buying Guide
How to buy Public Asset Control (PAC) token in 2026, PAC contract address, Solana wallet setup, Jupiter swap guide, latest price, liquidity, and risks.

What Is Public Asset Control (PAC) Token and How Does It Work? Latest Solana PAC Token Guide
Public Asset Control (PAC) token explained. Learn what PAC is, how it works on Solana, current price snapshot, risks, and buying basics.

Can PAC Coin Reach $1 Soon? Analyzing Public Asset Control
PAC is a Solana-based meme token with a government-themed narrative, but it is highly speculative.
At its current price (~$0.0009) and 1B supply, reaching $1 would require a $1B market cap, which is very unlikely.
Short-term moves to $0.001 or $0.01 are more realistic, but the token is highly volatile due to low liquidity and hype-driven trading.
Overall, $1 is not a realistic target, and PAC is better suited for short-term speculation than long-term investment.

United Nations Oil Reserve (UNOS) Crypto: Solana Token, UN Links, and Risks
United Nations Oil Reserve (UNOS) Crypto explained: Solana token basics, UN links, oil-backing claims, market risks, contract checks, and buying cautions.

What Is Public Asset Control (PAC) Coin? Explained for Beginners
Public Asset Control (PAC) is a Solana-based token that uses a “government asset control” narrative involving oil and gold themes, but it has no verified ties to any real institutions or governments. It is mainly an entertainment-focused, speculative meme coin.
The project’s claims about links to entities like BlackRock or Palantir are unverified, and its own disclaimer states it is not a real financial or institutional asset. Like many new Solana tokens, PAC is highly volatile, with low liquidity and limited transparency, including no fully verified audit.
Overall, PAC is a high-risk speculative token driven by hype and storytelling rather than real utility. Beginners are advised to be cautious, verify contract details, and prioritize risk control before considering any trading.
What Is Official Saudi Oil Reserve (OSOR) Coin?
Learn what OSOR coin is, why its Saudi oil narrative matters, how to verify the contract, and what risks to check before trading.

Global Digital Oil Reserve (GDOR): What It Is, Risks, and How to Check It
Global Digital Oil Reserve (GDOR) is an oil-themed Solana token with unclear backing. Learn its risks, market data, and verification checklist.

Is OBC Crypto a Good Investment?
Is OBC crypto a good investment? We analyze the latest market data, holder concentration, liquidity risks, and short-term momentum. Read this before you invest in OBC token.

Can OSOR Reach $1? Full Price Analysis 2026
OSOR crypto price prediction 2026: Can Saudi Oil Reserve token reach 1? Read before buying.

What is International Oil Supply (IOS) Coin?
Wondering what is IOS crypto? Here’s a straight look at International Oil Supply (IOS) coin—the Solana token tied to oil reserve data. Contract address, risks, and what’s still unverified.

What Is the Unified International Token (UNIT)? Is UNIT Crypto Legit or Scam?
what is UNIT crypto? Here’s a breakdown of the Unified International Token ($UNIT), how it ties to BRICS+ data, where to buy it, and why it’s a conceptual project—not an official currency.
What Is Stablecoin Business OS (SBOS) Coin?
What is SBOS crypto? We break down Stablecoin Business OS, its USDC invoicing tools, AI finance assistant, token contract address, and real utility for online businesses.

World Collective Oil Reserve ($WCOR) Price Prediction: May 2026 Rally Analysis and Future Outlook
Is $WCOR a good investment? Read our comprehensive World Collective Oil Reserve price prediction and market analysis for 2026-2030. Learn about the energy narrative on Solana and start your trading journey with WEEX rewards.

Is $PAC Token a Good Investment in 2026? Price, Risks, and Market Analysis
A data-driven analysis of Public Asset Control (PAC) token: current price, market cap, liquidity, $1 target feasibility, and risk factors. Is it a legitimate investment or a high-risk meme coin?
NEAR Airdrop: Join WEEX to Share 50,000 USDT in Crypto Rewards
Join the NEAR airdrop on WEEX from May 7 to May 14 to share a 50,000 USDT prize pool. New users can earn rewards through deposits and spot trades with zero-fee trading advantages.

How to Buy $WCOR Coin: Should I Invest or Is It Just Hype?
Learn how to buy $WCOR coin on Solana and explore its latest 57% price surge. This expert guide analyzes whether WCOR is a solid investment or speculative hype.
What Is $PAC Token? Legitimate Crypto or Just A High-Risk Meme Coin?
Is Public Asset Control ($PAC) a real asset-backed token or just another meme coin narrative? We analyze its official website, market data, and risks.
What Is SAOS? Strategic American Oil Supply Token Explained
SAOS is a meme token on Solana with a 75,000 USD market cap and 22,000 USD locked liquidity, positioned around oil supply themes but lacking real asset backing
It thrives on pure narrative speculation, with no utility, website, or doxxed team, making it highly volatile and attention-dependent
Traders should distinguish SAOS from legitimate real-world asset projects, as its branding is speculative rather than substantive
Positive aspects include locked liquidity reducing rug pull risks, but low trading activity signals high uncertainty
How to Buy Public Asset Control (PAC) Token in 2026: Latest Solana Buying Guide
How to buy Public Asset Control (PAC) token in 2026, PAC contract address, Solana wallet setup, Jupiter swap guide, latest price, liquidity, and risks.
What Is Public Asset Control (PAC) Token and How Does It Work? Latest Solana PAC Token Guide
Public Asset Control (PAC) token explained. Learn what PAC is, how it works on Solana, current price snapshot, risks, and buying basics.
Can PAC Coin Reach $1 Soon? Analyzing Public Asset Control
PAC is a Solana-based meme token with a government-themed narrative, but it is highly speculative.
At its current price (~$0.0009) and 1B supply, reaching $1 would require a $1B market cap, which is very unlikely.
Short-term moves to $0.001 or $0.01 are more realistic, but the token is highly volatile due to low liquidity and hype-driven trading.
Overall, $1 is not a realistic target, and PAC is better suited for short-term speculation than long-term investment.
United Nations Oil Reserve (UNOS) Crypto: Solana Token, UN Links, and Risks
United Nations Oil Reserve (UNOS) Crypto explained: Solana token basics, UN links, oil-backing claims, market risks, contract checks, and buying cautions.
What Is Public Asset Control (PAC) Coin? Explained for Beginners
Public Asset Control (PAC) is a Solana-based token that uses a “government asset control” narrative involving oil and gold themes, but it has no verified ties to any real institutions or governments. It is mainly an entertainment-focused, speculative meme coin.
The project’s claims about links to entities like BlackRock or Palantir are unverified, and its own disclaimer states it is not a real financial or institutional asset. Like many new Solana tokens, PAC is highly volatile, with low liquidity and limited transparency, including no fully verified audit.
Overall, PAC is a high-risk speculative token driven by hype and storytelling rather than real utility. Beginners are advised to be cautious, verify contract details, and prioritize risk control before considering any trading.
